April 2025 build (package)
Distribution Contents
This package has been updated as of 25 Apr 2025.
To use the tools, one needs to already have a valid license with an active maintenance subscription. The license file needs to be placed in the same directory where the tools are located (in the /bin directory that is part of the package). If you experience problems with this distribution, contact davet@tzworks.net for assistance.
Release Highlights (Apr 2025)
Updated the Browser Parsing tools
The tools (csp, msp and sap) were modified to handle the latest schema changes (as of Apr 2025) for browsers based on: Chrominum, Mozilla and Webkit. Also, updated the signatures that are used in these tools. The updated signatures allows one to parse records from corrupted databases, or unencrypted memory dumps, containing database records that pertain to one of the browsers listed above.
Enhancements to some of the TZWorks Internal libraries
Expanded a few of the internal TZWorks' libraries for new use-cases. The newer functionality may or may not be used in an existing tool, however, some of these libraries touch all of the tools from a code baseline standpoint, and are mentioned below.
-
- Timestamp library. Does a better job of filtering out-of-bound timestamps. Handles more use-cases from a collection of timestamps with differing epochs and format representation. The out-of-bound conditions usually occur if the artifact data being considered has been corrupted (usually from a carving operation).
- Logging and Unicode/String libraries. Incorporated thread-safe routines to these libraries to allow newer (or upgraded) tools to operate in a parallel processing fashion. While these changes do not necessarily benefit those TZWorks tools that are single-thread (from an increased speed standpoint), the changes indirectly effect code baseline for these older tools.
- SQLite (both open and internal) libraries. Updated the open source SQLite library (to use the amalgamation version 3.47.0). This library is statically linked into those tools that make use of it; this means there are no outside dependencies needed to use the library when the tool runs. This functionality is used if a tool has an option to archive the parsing results into a SQLite database for output. In addtion to the open source library, this build also updates the internal TZWorks' SQLite library. The changes allow carving records to be more robust. The internal SQLite library carving operation typically yields more records than that of a normal SQL query using the standard SQLite library, since deleted records are commonly found and parsed out.
Release Highlights (Jun 2024)
Updated the Timeline Activity Cache tool (tac)
Handles the lastest SQLite schema changes with in the ActivityCache database. Specifically tac now handles many of the new changes to the Activity and the ActivityOperation tables. This version should handle the both the older and new schema versions through Windows 11 update as of Jun 2024.
Updated the Windows Push Notification tool (wpn)
Handles the lastest SQLite schema changes with in the wpndatabase.db. Specifically wpn now handles many of the new changes to the Notification and the NotificationHandler tables. This version should handle the both the older and new schema versions through Windows 11 update as of Jun 2024.
Release Highlights (Apr 2024)
Updates to the browser parsing tools (csp, msp and sap)
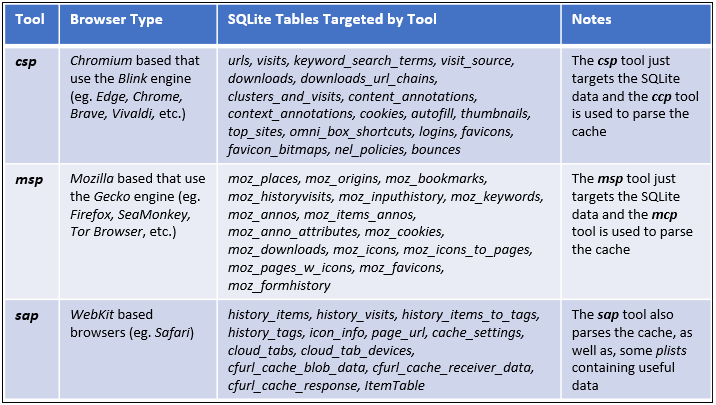
These tools have been updated to handle the lastest SQLite schema changes. As the respective browsers evolve over time, the schemas for the SQLite databases used in those browsers are updated with new fields and/or new databases. This release of the csp msp and sap tools, now handles many of the new changes. It should be noted, that these enhancements to the tools did not impact the backward compatibility of the tools ability to parse older schemas. As an example, if one looks at the msp tool which parses the Mozilla based browsers, and considers the tables in the various databases in the browser, the tool should handle schemas starting from version-3 to version-124 (which was the latest as of Apr 2024). To see the scope of which SQLite tables are parsed by which tool, see the summary below.
As a side note, the SQLite parsing done by these tools can operate in one of three ways depending on the command issued by the user.
-
-
Default option. Uses the internal SQLite library that is statically linked into the tool(s)
to perform a SQL-Select statement on the database under analysis. Things to note with this option, include:
- This option is sensitive to corrupt databases. Corrupted database cause the SQLite library to fail.
- Will not parse out records from unused or slack space.
- Will not parse databases that are in-use by a browser, in that the database will be locked down from concurrent access using the SQLite Library.
-
Carve option. This uses a TZWorks based set of algorithms to traverse the SQLite
data structures to parse the records in the database. It relies on the database's internal
tree-based structures to find the data. Things to note with this option, include:
- Works fine even if the database cannot be opened via the standard SQLite library. Live collection and parsing can be done when the database is in use by a browser.
- When database corruption is present, this option skips bad records and attempts to go to the next one.
- Deleted records are identified and parsed.
-
Signature-base option. (experimental) This does not make use of the SQLite tree-based
structures in the database to locate records. Instead, the tool looks for certain signatures to locate
records and parse them. Empirical testing has shown this approach works with the following scenerios: either a good
database, corrupted database or a partial blob of a database. Things to note with this option, include
- If the file under analysis is the database file (even if partially corrupted), most if not all, of the records can be extracted.
- If the file under analysis is from a raw physical memory dump (where adjacent pages do not represent contiguous virtual memory), then some of the records can still be parsed that are contained within page boundary's.
- The signatures compiled with the tool need to match the schema of the records desiring to extract. Said another way, the current version of the tools should handle the records from the browsers listed above and their versions up to this release (eg. Apr 2024). As schemas are changed over time, new signatures need to be incorported into each tool.
-
Default option. Uses the internal SQLite library that is statically linked into the tool(s)
to perform a SQL-Select statement on the database under analysis. Things to note with this option, include:
The primary use of the Default option is it allows one to validate the output of the other two options. Ideally, the Carve option would yield the most records. Details about each of these options is discussed in the respective user's guide.
Enhancements added to dup
-
- As background, the imaging process done by dup is from reading raw bytes during disk sector reads and copying these same raw bytes to a file (eg. a dd image). This is still the default behavior. A new option was incorporated to read these raw bytes as translated by the operating system so as to obtain a decrypted version of the volume. The use-case is if one wanted to image a mounted volume that is BitLocker encrypted and generate an unencrypted volume image. This option makes use of the running Windows operating system to translate the encrypted bytes to their unencrypted state. The resulting image will be a translated (unecrypted) dd image of the volume. Consequently, this option relies on the target volume being: (a) BitLocker mounted and (b) accessible to the admin user when running the dup tool.
- Improved handling of bad sector logic during imaging. If imaging a drive and a bad sector is encountered, dup, will cancel the I/O request to the disk, write zeros for the sector, and go on trying to read the next sector. This allows the imaging process to continue without the tool stopping. There are tunable parameters that allow the user, to specify the timeout period and number of tries when encountering a bad sector. All bad sectors encountered are recorded in a summary report.
- For the file copy operations, this release includes the option to limit the copy operation to files that are later than some specified create/modify date. While this option uses timestamp based logic, meaning it could be easily defeated if timestamps were manipulated, it nontheless is useful for certain situations.
Updates to jp
Modified the algorithm that filters journal entries to ensure more valid records are parsed. The modification may slighty increase the false-positive detection rate as a result of this change. The new algorithm is optimized to maximize the valid to invalid record parsing when analyzing deleted jp entries.
Release Highlights (Apr/May 2023)
Added ARM64 binaries to the suite of tools
In addition to Intel 32 and 64 bit binaries, we now include ARM-64 binaries for all the platforms. Previously, we updated the macOS binaries for the M1 and M2 Macbooks. This time we extended ARM64 to the Windows and Linux operating systems as well. The ARM64 builds for these were based on Ubuntu's ARM64 Jellyfish distribution and Windows Snapdragon from Qualcomm (SQx) chipset used in the newer SurfacePro laptops. The following table shows the breakout of the TZWorks builds available and what versions of the operating systems the tools should run on.
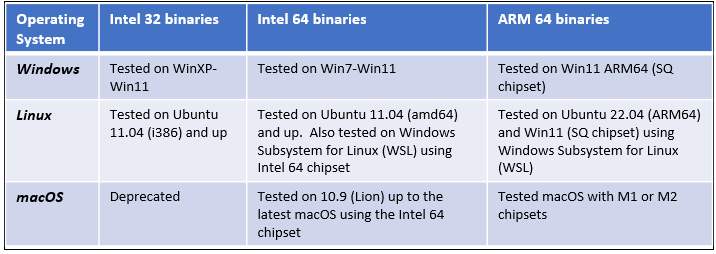
From the table above, one should note that for Windows, the Win32 binaries should work on all flavors (CPU type and version), even for the Win11 ARM64. This is because Win11 ARM64 has an emmulator to allow many of the Intel 32 bit based binaries to run. For TZWorks, this includes all versions of Intel 32 bit (and Intel 64 bit) compiled binaries. In emulation mode, however, the binaries will operate slower but still will work. Conversely, the native compiled binaries are much faster and require less CPU resources.
For Linux, only the native CPU-based compiled binaries will work on their respective CPU version.
For macOS, the fat binary contains both the Intel and ARM 64-bit binaries embedded into one Mach-O package. This allows the host operating system to use the optimal binary version contained in the package. The Mach-O packages have been tested on Lion OS-X (version 10.9) up to the latest macOS versions (using Intel or ARM chipsets). The GUI version of the tools ( yaru, gena, evtx_view , and pe_view) require the X-Windowing system (X11) to be present. This was included in the older versions of OS-X, but not with the new versions of macOS. The X-Windowing system can be added to any macOS where it is not present, by installing the XQuartz distribution (www.xquartz.org).
Release Highlights (Dec 2022)
New Tool Added - fata
fata is short for FAT32/exFAT Analysis. It was designed to be light-weight and assist in the analysis of both FAT32 and exFAT filesystems by looking at only the raw disk sectors or volume sectors. The tool's algorithm is operating system agnostic when parsing files or folders, and since it has no installation requirements, it is useful in various live collection and triaging situations. There are compiled binaries for Windows, Linux and macOS. More information about the capabilities of this new tool can be found in the tool's readme and/or user's guide.
Release Highlights (Oct 2022)
Updates to Win32 and Win64 binaries
Modified some critical functions in the C/C++ runtime library so that all the tools could operate on the legacy Windows operating systems and still work on the newer versions of Windows. This change is only effects the Windows binaries so as to allow operation of the tools on a live legacy system, primarily for incident response use.
The breakout is as follows: (a) The Win32 binares will work on Windows XP through Windows 11 (either in 32 or 64 bit mode). (b) The Win64 binaries will work on Windows 7 through Windows 11 (only in 64 bit mode).
Release Highlights (Aug/Sep 2022)
Updates to ntfswalk and gena tools
Modified how NTFS hard links are handled and reported in ntfswalk. For each hard link encountered during the $MFT traversal, a separate delimited line is outputted per hard link, as opposed to including all the hard links in the same line. In this way, one can clearly see the filename, and in some cases, how the path is different. Each hard link is annotated with its reference to the base file record so there is tracability should one wish to validate the results.
Additional format changes were made to the output so as to condense some of the information. (a) Where it makes sense, multiple data attributes are still enumerated but are consolidated. (b) the path/filename is now split between two separate fields, (c) added a SHA256 hash option to supplement the current MD5 and SHA1 options, and (d) some other formatting changes to allow more internal metadata to be reported.
TZWorks' Core Libraries updated
This includes changes mentioned above for the NTFS library, but also for the PE (portable executable) library, raw disk library, timestamp library, and Unicode library. Aside from bugfixes, some noteworthy changes include the following:
The raw disk library now includes the capability for raw disk access to FAT32 and exFAT filesystems (similar to the current NTFS support). This new functionality allows one access to these filesystems without mounting the partition since reconstruction of the filesystem is done via raw cluster reads not going through the OS's filesystem API calls. This is important for 2 reasons: (a) it allows traversing through a filesystem if it was corrupted and cannot be mounted, and (b) it allows access to the internal filesystem structures for analytical review, especially if structures were modified intentionally to hide certain files or folders.
The timestamp library was modified, in that, the default behavior of the date format was changed. Instead of using the previous default format of mm/dd/yy for month/day/year, the default has been changed to a more universally accepted notation of yyyy-mm-dd. If this new default format is not desired, one still has the flexibility to adjust the date format to the older notation or some prefered notation using the -dateformat option.
The Unicode library was modified so it now includes an option to prefix the CSV output with a byte order mark. As background, all TZWorks' tools output the data as Unicode characters. The format of the Unicode, however, is in UTF-8 format (versus UTF-16 or UTF-32). Some applications (like Excel and other text viewing apps) would like to see the data that is imported prefixed with a byte order mark (BOM) to specify the format of the data. This allows the application to know how to render the data properly. Consequently, since UTF-8 is a variable byte Unicode format (for efficiency reasons), it uses one byte per symbol for ASCII characters and multiple bytes per symbol for less common characters. Because of this, the format of the file may be interpreted by an application as ASCII and not Unicode (UTF-8). This assumes that the application being used to render the data was not selected to display the data in UTF-8 format, but left to the application to display the data in some default format. Therefore, to assist users so their data outputs Unicode data properly, this build of the tools includes the capability to allow one to prefix the CSV output with a UTF-8 BOM as part of the command line. The new option is -utf8_bom. Please see the readme files for more information.
The above code changes touched on all the tools in one way or the other, so a complete build of all the tools is included in this distribution
Release Highlights (May/Jun 2022)
New Tool Added - ccp
ccp is short for Chromium Cache Parser. This new tool targets the Chromium cache artifacts. It has been tested on a handful of desktop browsers that are based on the Chromium source code. This includes: the newer Microsoft Edge, the Brave browser, the newer Opera browser, the Vivaldi browser, and Google's Chrome browser. While there are other browsers that are also based on Chromium, the ones listed above were the ones that the ccp tool was tested on, so the tool may or may not work on other Chromium based browsers. There are compiled binaries for Windows, Linux and macOS. More information about the capabilities of this new tool can be found in the tool's readme and/or user's guide.
Updates to Chromium SQLite parser (csp)
The cp tool, which targeted Chromium SQLite artifacts has now been renamed to csp with this, and follow-on versions of the build. The name change was done primarily for naming consistency reasons. csp was also upgraded to also target the same Chromium-based desktop browsers listed under the ccp tool.
Updates to Disk Utility & Packer (dup)
The dup tool was originally designed to focus on Windows artifacts, however, the tool could also perform some rudimentary collection in macOS and Linux. This latest update now allows one to invoke the batch mode option to pull artifacts from macOS and/or Linux. This functionality is similar to what was previously available for dup running in Windows. The benefit of using this mode for macOS or Linux is it allows one to extract a plethora number of artifacts via one command, while internally, dup spawns multiple threads to assist in the speed of the collection.
Other enhancements to the tool include options to: (a) extract various browser artifacts, such as: Firefox, Edge, Brave, Opera, Vivaldi, Chrome and Internet Explorer; (b) extract live/volatile network/process data; and (c) filtering to locate ESE db files. This latter option is similar to the SQLite and plist filtering optons added previously, in that the tool can locate ESE formatted db files by examining the internals of the file data to determine whether it is an ESE db as opposed to just filtering on the file extension. For a complete list of capabilities of dup, see the readme and/or user's guide.
Core Libraries (that are used across the suite of tools) updated
This build include changes to the common set of libraries used by all the TZWorks' tools. This was a combination of bug fixes and selected mods to the code base to handle the newer ARM and Intel based compilers/linkers. Therefore, all the versioning of the tools have been updated. For a list of which bug fixes were associated to each tool, see the respective tool's readme documentation.
Release Highlights (11 Dec 2021)
New Tool Added - evtfx
evtfx is short for EVTX Fragment eXtension parser. This new tool targets EVTX log artifacts. The purpose of evtfx is to address the shortfalls of EVTX parsers when it comes to corrupted or partial event logs. This tool is effective at pulling out most records from these types of log fragments, which can be from a memory dump, a collection of clusters from a 'dd' image of a volume, or just an incomplete reconstructed EVTX log that was carved by another tool. The only restriction is the data passed into the tool needs to be uncompressed and unencrypted. Versions of evtfx are compiled for Windows, Linux and macOS. More information about the capabilities of this new tool can be found in the tool's readme file and/or users guide.
Updates to all the tools
Various bugs were fixed that were in libraries common to the suite of tools. These changes resulted in new versions for all the tools. Please see the individual tool's readme file for explanation of the updates.
Release Highlights (16 Aug 2021)
Disk Utility and Packer (dup) Enhancements
Added a number of new features to the dup tool; including (a) an option to generate a SQLite log file of the artifacts copied, complete with the metadata associated with each file, (b) an option to extract INDX data from NTFS folders and parse this data, so that one has an independent view of what was in the folder, as well as, what may have been deleted from the folder; the output is similar to the TZWorks' wisp tool, (c) with regards to macOS, an option was added to extract Spotlight type metadata associated with the files that are copied, and finally, (d) additional filtering options were added allowing the tool to inspect the internal binary data of a file, to more completely target specific file types. The use-case for adding this last option, was to allow for the extraction of those file types that do not normally use a common file extension, such as SQLite files. More details about these capabilities are discussed in dup's user guide.
Apple macOS related changes
With the advent of Apple encouraging macOS application developers to get their tools notarized, changes were made to the TZWorks code base and build processes to ensure our tools can be code-signed with the hardened runtime flag. This, along with other Apple requirements, is an initial step for tools to be notarized. Therefore, with the release of this distribution, all our tools compiled for macOS have been successfully notarized by Apple. The goal here was to try to enable our tools to coexist with the macOS Gatekeeper filtering, and minimize the number of popups when running one of our tools. One will still get a Gatekeeper warning, however, if a tool was downloaded from the Internet.
The second challenge when encountering new requirements, such as notarization, is to ensure the changes the developer makes are still compatible with the older OS versions as well. In this case, older translates into macOS versions. Compatibility was achieved by continuing to build the tools using the dependencies from the previous macOS c++ runtime library. Fortunately, this did not negatively impact the notarization process nor impact the tools running on the newer macOS 11.x. Further, when combining the separate code sections from the Intel and ARM architectures, one is able to obtain a somewhat universal binary. The idea here, is to have one version of a tool to provide maximal coverage across the differing macOS versions and architectures. I did, however, restrict the tools to only handle 64-bit architectures (so no 32-bit code sections were added).
As an aside, initially this notarization task was done as an experiment, to see: (a) how difficult it would be to accomplish this without using XCode's graphical environment, and just use the command line tools which are also distributed by Apple, and if this worked, (b) could it be automated across our entire toolset using simple scripts. After reading articles from Apple's website, other developer's online blogs, and performing trial and error testing, the pieces started to come together. Turns out, if one has an Apple Developer's account, Apple gives you everything that is needed plus more (eg. command line tools, code signing certs, sample manual steps, etc). Automating the notarization process added about an hour to the build cycle for 36 tools without any human intervention. For those unfamiliar with our build cycle, it is something like this: compile-link-Intel64/compile-link-ARM64/create universal binary/code-sign binary/package with docs as dmg image/code-sign package and submit to Apple for notarization. So, if our normal build cycle, without notarization across our entire toolset, is 3 hours, adding the notarization step made the build cycle increase to 4 hours. The time for notarization could have been faster, but the initial script synchronously submitted the tools for notarization one at a time, waiting for the approval for one before submitting another one. Timewise, this is more than adequate, since the whole thing is automated anyway. While an obvious success, it will remain something of a 'work in progress'.
Continuing with the theme of our prior builds, the TZWorks tools are designed to be built as self-contained. This means, one can run a tool as standalone executable, out of the box, without requiring an installer. Normally, this just translates into ensuring any critical library the tool needs for its operation gets compiled in. The main assumption, of course, is the version of c++ runtime library used by the tool is also compatible with the version of OS. But aside from that, it is relatively straightforward. In lieu of Apple's notarization requirements, however, a few extra resources needed to be embedded into our tools to continue for them to be self-contained. These resources include: a unique info.plist, entitlement.plist, and icon graphicset. The goal here is to have the capability to run the tool from a removable device or any source without a fuss. There are a few tools where this is not the case, unfortunately, and those listed below.
With regards to the TZWorks tools that have a graphical component (eg. yaru, evtx_view, pe_view and gena), they will require the X Window libraries to be installed, if not present; the older macOS versions used to have the X Window system installed by default, but the newer ones do not. To install these libraries, the recommended solution is from XQuartz.org. This is an open-source effort to develop a version of X Window's that runs on macOS. These libraries were originally shipped by Apple with macOS versions 10.5 - 10.7.
Release Highlights (2 Mar 2021)
New Tool Added - sap
sap is short for Safari Artifact Parser. This new tool targets many Safari artifacts, including certain SQLite databases, associated property lists (plists), cookies and cache. The original design focused on those artifacts associated with the desktop version of the browser, however, many of these same artifacts appear in the mobile version of the browser as well. The distribution of this tool includes compiled versions for Windows, Linux and MacOS. More information about the capabilities of this new tool can be found in the tool's readme file or users guide.
Apple Silicon changes made to baseline build of tools
The command line tools built for MacOS have been updated to handle both the Intel 64-bit and ARM 64-bit processors. Both of these binaries are integrated into one binary (coined a 'fat' binary by the community). These 'fat' binaries allow the tool to either run on a Mac with either Intel or AMD based 64-bit processors. Running our tools on an ARM64 version of a Mac, however, should still be consider experimental.
Updated Internal SQLite Routines - cp and msp
The TZWorks' internal SQLite library now handles additional parsing if data is in UTF-16 format. Previously, the routines relied on data being in ASCII or UTF-8 format. Based on empirical testing, it was discovered that certain exemplar SQLite artifacts utilized multiple Unicode formats (such as UTF-16 as well as UTF-8). Therefore, this change allows for the internal SQLite routines to adjust accordingly and handle both Unicode formats.
ntfswalk Option Update
While this tool previously indicated if there was an alternate data stream (ADS) associated with the MFT entry, a new option was added to allow the user to display just those MFT entries where there is an ADS entry with a specified minimum size.
Release Highlights (12 Nov 2020)
Interim release to publish a couple of bug fixes for the usp and tela tools. Details are in their respective readme files.
Release Highlights (20 Oct 2020)
Updated Binary XML engine - evtwalk, evtx_view, pescan, pe_view
This is an out-of-cycle update to account for bug fixes affecting certain forwarded eventlog records. The changes also incorporate the ability to parse the [CharRefToken] and [EntityRefToken] primarily prevalant in certain forwarded event logs. Since the binary XML parsing engine is a common TZWorks library, a number of tools were affected and thus updated in this build.
Release Highlights (14 Sept 2020)
New Tool Added - msp
msp is short for Mozilla SQLite Parser. This new tool targets certain SQLite databases that are used in the Firefox desktop browser. The databases that this tool currently can parse includes: (a) places.sqlite, (b) cookies.sqlite, (c) downloads.sqlite, (d) favicons.sqlite, and (e) formhistory.sqlite.
While there are other Firefox parsers available, what is unique about this one, is it can: (a) extract records from a corrupted SQLite database (where the normal SQL statements will not work) and (b) parse database records from an uncompressed/unencrypted blob of data; meaning it can parse records without regard to the database structure. This allows one to extract and parse records from an archived memory capture or disk image.
Binary XML parsing engine updated - evtwalk and evtx_view
Certain eventlog's make use of user data to supplement the record output. This additional data manifests itself as a sort of freeform binary XML that does not map to a structured templates that are defined in the log file. This update allows parsing of this freeform data and inclusion into the results as formatted XML data. In addition to the above, the extraction and parsing of records in slack space was improved.
Release Highlights (24 July 2020)
New Tool Added - mcp
mcp is short for Mozilla Cache Parser. This new tool targets both the older cache from Firefox version 3 as well as the new cache format in the current version of Firefox. The tool can output the results to either a CSV file or an SQLite database. The SQLite output allows the content data to be archived along with the cache metadata. More information about its capabilities are discussed in the user's guide. Since this is the first release of this tool, it should be considered experimental for now.
Event Trace Log updates - tela
Incorporated a new template into tela to parse out the fields of the Microsoft-Windows-PktMon provider. For those not familar with the provider, this is the new built-in network sniffer that was updated back in fall of 2018 for Windows 10. The packet sniffer is named, "pktmon.exe". When invoked, it generates an ETL (event trace log) file to archive its data. The update for tela can now interpret the format of this type of data.
$MFT and $Logfile parser updates - mala
The $Logfile parsing continued to be improved in both parsing accuracy and speed. When merging $MFT artifact data with $Logfile records, path reconstruction was improved in both accuracy by drawing on the internal UsnJrnl:$J change log records embedded in the $Logfile. In some cases, not all the information may be available to generate a path with high confidence. In these cases, mala will report which efforts were 'guesses' with some level of confidence and which were not guesses.
Shim Database Parser updates - shims
With this new update, the tool can now handle compressed shim database files and intepret many of new tags that where added with Windows 10. Also, cleaned up the formatting of the XML output.
Disk Utility & Packer - dup
Added extraction for Mozilla/Firefox and shim databases to the group copy options; cleaned up a number of boundary condition bugs.
Tools that make use of SQLite - tac, cp, csvdx, wpn, elmo
Updated the tools that use the SQLite library to the latest stable version, which is version 3.32.3. Changes to this library can be referenced at: [https://www.sqlite.org].
Release Highlights (11 May 2020)
New capability to compare registry hives
Comparing registry hive snapshots is not something that is new to the forensics community, but based on requests from users to add it to cafae, a new option was added to compare like hives from different points in time. The reporting of the differences can be outputted in either CSV for Log2Timeline formats. This capability should be considered experimental. If interested in more information and limitations about his option, see the tool's readme document or user's guide.
Other enhancements to cafae (as well as to yaru) include parsing of artifact data from the subkey: ntuser.dat\Software\Microsoft\Windows\CurrentVersion\Explorer\FeatureUsage.
New capability to extract deleted eventlog records
evtwalk was enhanced to include an option to parse event log records from slack space (slack space is defined here to be unused space in the event log file). When outputting these records the tool clearly marks which records were deleted and which were not. This capability should be considered experimental, in that it needs more testing across a broader collection of event log files to ensure the tool handles nuances that come about from various boundary conditions when carving data. If interested in more information about this option, see the tool's readme document or user's guide.
Event Trace Log updates - tela
Incorporated a new template into tela to parse out the fields of the Microsoft-Windows-Security-Auditing provider.
Release Highlights (16 Jan 2020)
Build focuses on various bug fixes and maintenance updates.
-
- cafae - added an experimental merge option to update a hive with its transactional log file(s). The resulting merged hive is stored as a separate file. See the user's guide for more information on how to use and limitations thereof.
- cafae/yaru - enhanced the detection of the deleted keys/values. Previous algorithm only looked into unallocated data chunks; new algorithm also looks into allocated big data chunks that may contain left over key/value records.
- dup - updated the artifacts extraction algorithm when targeting a 'dd' image.
- evtwalk / evtx_view - fixed boundary condition when parsing certain log files.
- csvdx - added formatting sub-option when using the JSON output. See the user's guide for more information.
- ntfswalk - fixed bug pertaining to path reconstruction for deleted entries.
The changes to the above tools indirectly updated many of the other tools as well. See the respective readme files for the tools to see if any common libraries used by the tool(s) of interest were affected.
Release Highlights (10 Nov 2019)
Build focuses on various bug fixes and maintenance updates:
-
- cafae / yaru - added NetworkSetup registry artifact in system hive report.
- evtwalk / evtx_view / usp / elmo / shims - fixed boundary conditions when parsing corrupted event logs.
- csvdx - adjusted algorithm to minimize local memory used when processing very large CSV files.
Release Highlights (15 Sept 2019)
Build focuses on various bug fixes and maintenance updates:
-
- It was brought to my attention that with the newer Jump Lists, there is a field in the metadata which appears to equate to the interaction count for a particular LNK file. This new field is now extracted and shown in the output with the jmp tool.
- Made some enhancements to the dup tool. The tool was primarily designed to extract data from live system volumes for IR purposes. However, for offline extraction of data, it can also handle an NTFS 'dd' image that is unmounted ('dd' used in this context is defined here to be those images that are uncompressed and unencrypted). This latter capability initially targeted a volume image, but has now been expanded to more reliably extract data from disk images with multiple volumes present.
- Expanded the registry report for both cafae and yaru to include the extraction of some additional MS Office keys for 'File/Place MRU' data and 'Word/Reading Locations' from the user hive.
- Various clients provided exemplar datasets that highlighted a number of boundary conditions in several tools. All identified bugs were fixed in this build. Please see the readme files for the individual tools to see if they were affected.
Release Highlights (7 Jul 2019)
New Tool Added - mala
mala is short for $MFT and $LogFile Analysis. This new tool targets the $LogFile artifact and uses the $MFT file for additional context data. Since this is the first release of this tool, it should be considered experimental for now.
As background, the Windows NTFS file system has a transactional architecture that is used to ensure that the operating system can recover from a crash into a known good state. To achieve this level of reliability, Windows NTFS employs a journaling technique that records the sequence of file operations within the $LogFile. After the sequence of operations is completed, the operating system commits the changes and the transaction is done. In this way, if the system should crash prior to a transaction being committed to disk, the system can read the sequence of changes from the $LogFile and then perform (if necessary) any 'undo' operations to get the system into a known good, stable state. The $LogFile contains both the 'redo' and 'undo' operations for a transaction. From a forensics standpoint, the $LogFile can be considered a sliding window in time of a list of historical transactions that were done. The window in time is restricted by the size of the $LogFile which gets overwritten by previous transactions as the size of the log is reached. If interested in more information about this tool see the readme document or user's guide.
I/O Enhancements
Many of the TZWorks tools send their output to the screen (or stdout). If one chooses to do so, this output can be redirected to a file. Up until now, this was the primary way to send output to a file. Some of the tools incorporated a secondary option which allowed one to do the same thing via the option -out <result_file>. With this new release, this secondary option was incorporated into all the tools. Now one can explicity send the output to a file, using the new option (-out <results_file>). The original functionality of the tools are unchanged and should not impact existing scripts that redirect stdout to a file.
The second change that was made was to enhance the input options for a tool. This capability is only for those tools that incorporate the -pipe option. As background, the -pipe option allows a TZWorks tool to use standard input (or stdin) to receive data. Using stdin, one could direct many artifact files into a tool to be processed in one session, which is great for bulk processing. Using stdin this way is also a common technique for command line tools to chain the output of one tool into another tool. However useful this option is, there are use-cases where one would like to use a third party tool to spawn a TZWorks tool and the third party tool cannot handle the stdin syntactical control. To address this special case, this distribution of the tools incorporates an alternative way to send multiple artifact files into one of our tools without using stdin (the syntax for this other option is -enumdir <folder>). This secondary option performs the same functionality as the -pipe option without relying on stdin. See the documentation on the various tools for more details if desiring to use this.
Disk Utility and Packer (dup) Updates
Added an experimental wipe option to the dup tool. The goal was to have a capability to securely delete a single file (-wipefile <file>) or all files within a folder/subfolders (-wipedir <folder>). The tool tries several techniques to both scramble the data and metadata associated with a file prior to deleting it. The most common technique for erasing the data is to just overwrite the file several times while flushing the buffer during each overwrite. There are other techniques the tool uses to target the metadata associated with the file. These latter techniques are considered more anti-forensic in nature. Orignially, this was added in for an experiment that needed a wiping capability for another internal project, but decided to leave the functionality into dup for enterprise clients to use as well. This new capability should be considered experimental, and is still has a 'work-in-progress' status.
Bug fixes for tools: evtwalk, evtx_view, usp, and jp
Please refer to respective tool's documentation on specifics of bug fixes.
Release Highlights (27 Apr 2019)
Pretch parser (pf) Updates
The preview version 1903 of Win10 made some modifications to the prefetch metadata. Consequently, updates needed to be made to the pf tool to accommodate this format change. Since this change was analyzed using the pre-release of version v1903, this change should be considered experimental until more testing is done on the final release of v1903.
Timeline Activity Cache (tac) Updates
The SQLite schema for few of the database tables were modified in the ActivitiesCache.db with the pre-release version 1903 of Win10. When looking across the various schema changes that occurred for this artifact [v1803 (Apr 2018), v1809 (Oct 2018), and v1903 (May 2019)], changes were made to the tac tool so as to handle each of these version variants on the fly. The algorithm is smart enough to even adjust to schema changes on the same database under analysis. Interestingly, this happens when a OS is upgraded from a previous version that has a schema change. For the case when the database is upgraded to the newer schema, any older deleted records still are formatted using the older schema. Therefore, proper recovery of these older records requires the tool to do this schema adjustment on the fly so as to detect and parse any older records still present, while still being able to handle the records with the newer schema.
Windows Push Notification (wpn) Updates
The SQLite schema was modified for this database as well with the pre-release of version 1930, however, the changes were minor to one of the existing tables that is parsed. Major changes included: (a) enhancing the carving option to be more accurate, (b) minimizing the numbers of false positives when scanning for deleted records, and (c) adding the ability to provide joins (for the carving option) between certain tables that have a relational aspect.
Trash Inspection and Analysis (tia) Updates
Previously the tia tool targeted only the index records in the Recycle Bin. For Win7/8/10 these are the files that start with $Ixxx; for WinXP these are the INFO2 files. This newer version of the tool integrates the data from the index entry records with the actual deleted files to provide more meaningful results (for Win7/8/10, these are the files that start with $Rxxx; for WinXP the files that start with Dcxx). Why is this important? The index records are great for providing metadata for those files that were separately deleted, however, if one deletes a folder (that has files within the folder), then only the folder information is located in the index record and not any of the files that were in that folder. Therefore to get statistics about the files in the folder that was deleted, one needs to also traverse the $Rxxx folder or Dcxx folder, depending on the OS that is analyzed.
Disk Utility Packer (dup) and gena Updates
The disk enumeration option for dup and gena was updated so more information is provided for each partition/volume. While the older versions of these tools would enumerate the raw disk information just fine, this newer version associates volume letter, volume label and volume GUID to the raw disk statistics.
Specifically for dup, also added a shortcut option to gather certain user account databases, including the ActivityCache DB's, Push Notification DB's, WebCache DB's and Chrome artifacts.
Registry Analysis cafae and yaru Updates
Added parsing of additional keys from the Background Activity Moderator (bam) artifact.
Release Highlights (19 Feb 2019)
New Tool Added - cp
cp is short for Chrome Parser and targets certain databases used by the Google Chrome Browser. Chrome makes extensive use of SQLite type databases in its architecture. Consequently, this tool extracts records useful in tracking user browser activity from 7 databases. They include: History, Cookies, Web Data, Top Sites, Shortcuts, Login Data and Favicons.
One may ask, why build another tool to parse SQLite databases, since there a number of generic (and free) tools that do this that are quite good and are already available? The answer is, I wanted something that could extract records from either a corrupted database or a locked database. The answer was found by researching the SQLite architecture and its record structure. As a side benefit of the in-depth research, it became apparent that one could also extract records from a memory or disk image without regard to the database structure being intact.
To offer more flexibility to the analyst, the cp tool exposes 3 parsing engines, each geared toward a different scenero. (a) The first uses a normal SQL-Select type of record parsing (which is what many free tools do); (b) the second targets corrupted or locked down databases, where the tool reads the database like a raw file and just walks the internal SQLite structures bypassing any corrupted portions, and (c) the third is a signature-based scan which reads a file in chunks and can parse Chrome records without regard the database structure. This latter option could be used to parse an archived memory capture or disk image.
Just to be clear, this tool only targets certain SQLite databases; it does not look at the Chrome cache and other Chrome artifacts. Finally, the tool should still be considered prototype. As more knowledge is gained with Chrome and its internals, the cp tool should become more robust over time. If interested in more information about this tool, see the readme file and/or user's guide.
dup Updates
Added the ability to use wildcards to specify unknown folders during a copy operation. When developing the Chrome Parser (cp) tool discussed above, I found this was a useful option for extracting all the data from every account on a target system without necessarily knowing beforehand the account names. The use of wildcards was a welcomed timesaver. In this case, one would use a wildcard for the account name, and all the desired subfolders would be extracted from each account. This functionality was also extended to 'dd' type images, which is a little more difficult, since the the wildcard functionality needed to be implemented at the raw NTFS level versus relying on the Win32 API.
cafae Updates
Added an option to parse records from the Syscache.hve.
tac and wpn Updates
Many modifications where made to the our internal SQLite library when developing the cp tool, which is shared with the tac and wpn tools. Some of these modifications include: better record truncation handling and boundary condition roubustness.
Release Highlights (20 Jan 2019)
New Tool Added - bs
bs is short for Microsoft Office Backstage Parser. With the newer versions of Microsoft (MS) Office programs, when you first start Office you will be presented with the Backstage view. From this view, you can create a new document or open an existing file. One can also see the most recently used files listed on the left side of the view.
In order for MS Office to render the past history data, it makes use of some persistent information stored on the computer. For MS Office 2016, this file history data is contained in each user's respective directory. Of interest to the analyst is the data that contains references to file and folder paths (both local and remote), each timestamped with the last modified time. So, while the records identify files and folders used in the past, it doesn't necesarily mean they still exist on the system. Therefore, this data can be good in identifying user activity in conjunction with certain files even after these same files may have been deleted or moved elsewhere. For more information, see the readme file and/or user's guide for more information about this tool.
Release Highlights (9 Jan 2019)
Registry Related Updates
Modified the carving algorithm in cafae and yaru to do a number of things: (a) be aware of the newer format used for registry transactional logs, so it can automatically detect and parse either the old and new logs, (b) better job of identifying unlinked keys, which are keys with the link from the child key to the parent key removed (or the parent key deleted), and (c) for transaction logs, tools do a better job of re-building the subkey path.
Other Updates
Improved the detection of USB devices registering as a SCSI interface in usp. The report generated takes into account this new data
Improved the recovering of SQLite records from slack space. This affects the tac and wpn tools.
Fixed a bug in dup tool that affected the tar/gzip option. Also enhanced the canned registry extraction option (-pull_reghives) to extract the user hives transactional logs as well as normal hives. Previously the tool only did this on the system based hives, and didn't do this for user hives. So the new version should extract all registry transactional logs.
Added an option to ntfswalk to examine each MFT entry enumerated and extract the first 256 bytes of data so as to scan for strings. The results use the same CSV format as before, with a new field appended containing any strings found.
Release Highlights (20 Oct 2018)
Maintenance Updates
No new features were added in this build, however, various bugs and boundary conditions were fixed primarily across the various string handling routines. A few were Unicode based; others were boundary conditions that may be invoked if the artifact data is corrupted (usually from carved data). Since some of these routines were used throughout all the tools, a complete build needed to be done.
Release Highlights (22 Sept 2018)
New Tool Added - wpn
wpn is short for Windows Push Notification database parser. The Window Push Notification Services (WNS) allows applications to send notifications to the user, either as a popup message, a sound that is played, or as an image overlay over an icon/tile present on the status bar or desktop. This service was added by Microsoft starting with Windows 8. If one fast forwards to Windows 10 build 1607, you find the WNS changed the format to store its records from a Microsoft proprietary database into the commonly used database architecture of SQLite. This decision has continued on in the later Windows 10 builds as well. From an artifact parsing standpoint, a database that can be quered with SQL statements is easier to handle from an analyst or developer point of view.
The initial version of the wpn tool targets this artifact's newer SQLite format. The tool doesn't require one to understand Structure Query Language (or SQL) and it offers the ability to recover records that have been discarded and/or partially overwritten. From the empirical testing done thusfar, the number of records recovered from slack/invalid pages usually exceeds the number of valid records; the conclusion here, is without looking into the slack/invalid pages one could leave plenty of artifact data unanalyzed. Albiet, some of these recovered records are duplicative in nature, many are not, and consequently do offer additional data over and beyond the normal valid records. For those interested in more information, see the tool's readme file and/or user's guide.
tac Updates
The tac tool has been updated to include two more parsing options. These options strickly focus on carving target the records in the Activity and ActivityOperations tables that have either been corrupted or only partial versions of the database can be recovered. See the tool's readme file and/or user's guide for more information.
pescan Updates
There have been a number of folks using the pescan tool to identify suspicious portable executable (PE) files (eg. exe's, dll's, sys's, etc type binaries), using the -anomalies option. For those unfamiliar with this option, it tells the tool to analyze a PE file's internals and determine if the composition of the PE file looks abnormal. While what is normal or abnormal can be argued as highly subjective, this option does a pretty good job of finding those apps, libraries or driver files that try to do something different than a normal Windows build of a tool.
The tool works fine for PE files that are not missing chunks of data or are not severly corrupted. However, when carving out PE files from unused space on an image using a 3rd party tool, the data can be severely corrupted and/or large chunks of data missing, which will result in the reconstructed PE file containing garbage. This can result in the pescan tool to try to read the garbage, and if it is interpreted as a reference that is not backed by file data, it could result in the tool crashing. Therefore, the updates to this tool try to improve the robustness of handling PE files that have some sort of corruption or missing data.
Release Highlights (1 Aug 2018)
New Tool Added - tac
tac is short for Timeline ActivitiesCache parser; ActivitiesCache defined here is the ActivitiesCache.db database associated with the new Timeline application which was released as part of the April 2018 Win10 update. The Timeline application advertises that one can to go back in time to find the items previously worked on. It has a history from the most recent tasks to up to a month ago. Whether going back to a previous Internet search that done in the past or continuing on with the document that was been read or edited, the functionality is built into the Timeline application to do this.
For obvious reasons, this type of user activity history is useful for the forensic analyst. The tac tool targets this database and extracts any user activity recorded. The database relies on the SQLite archtitecture to store the user activity. For the initial version of tac, one can not only parse out the valid SQLite records, but can recover past records that are in invalid pages and/or slack space. The recovery ability is done on a best effort basis and should be considered experimental in nature. See the readme file and/or user's guide for more information about this tool.
Additional Registry Artifacts parsed in cafae and yaru
A number of improvements were made on the registry parsing front. Listed in no particular order, these include: reporting on additional timestamps embedded into the Task schedule; updated the Background Activity Monitor (bam) parsing; added a translation for the Windows DigitalProductId to retrieve the activation key used for the OS; added parsing for Terminal Server Clients; and a few others. Various other improvements were made in the form of bug fixes.
ntfswalk Zone Information option
For NTFS filesystems, when a file is downloaded from the Internet, a hidden alternate data stream (ADS) is embedded into the file. The ADS is named the "Zone.Information" and used to include just what zone the data was downloaded from. Presently this ADS is being used to store additional information, such as the URL of where the file was downloaded from. Other information may also be present and depends on the browser used.
Starting with version 0.74, an option was added to extract the "Zone.Information" data and include it into the final output. For more information about this option, refer to the readme or user's guide documentation.
Various additions and bug fixes
See the tool change log sections in the individual readme files for more information.
Release Highlights (23 Apr 2018)
New Tool Added - minx
minx is short for Modular Inspection Network Xfer (minx). It acts as an programmable agent to gather forensics data from one or more endpoints and send the data across the network to a central collection point. For this tool, the collection point is one of the older TZWorks tools called nx that acts in server mode.
The network relationship between the minx client and the nx service uses peer-to-peer communication. For peer to peer communication, no domain credentials are required to be set up if deployed in an enterprise network. As long as minx can communicate to the nx service's IP address/port, without being impacted by firewalls or other network devices that can block IP traffic, the communications should be seamless.
The functionality put into minx includes: (a) an integrated NTFS engine to allow minx to copy any file from a host Windows computer by accessing the file data via raw cluster reads, (b) an ability to scan all drives attached to a Windows computer, (c) an ability to image or copy any number of bytes from a specific drive or volume, (d) an internal directory enumerator with filtering to target specific files within one or a group of subdirectories, (e) the ability to spawn other applications and act on their output, (f) the ability pull common artifacts from all the volume shadow copies, and (g) an internal scripting engine that allows minx to receive instructions from the nx service and act on them.
More information about minx can be found here.
Handling of extremely fragmented/large NTFS Master File Table ($MFT)
Our internal NTFS library has been updated to handle very large and fragmented $MFT data. All the tools that examine the $MFT as part of their collection or parsing of data have been updated with this change.
As background, the NTFS Master File Table (or $MFT) keeps track of all the cluster runs for the FILE records that identify all the files and folders on the volume. Typically the cluster runs for the $MFT are small enough from a data storage standpoint to house this data within its own resident FILE record. This is because when the NTFS is initialized, it tries to reserve a set of clusters that are continuous (1 cluster run if it is successful) to handle the $MFT data. This is the normal behavior of most systems. However, when it comes to servers or systems that have an application or service that is generating hundreds of thousands of tiny files on the system in a short period of time, the $MFT can grow very large beyond its initial reserved cluster allocation, and consequently becomes fragmented. As new cluster runs are added to the $MFT during this process, it eventually grows beyond the size that is available in resident storage, and therefore resorts to allocating new FILE records with the sole purpose of storing the new cluster run data. This situation doesn't happen very often, but when it does, this case is now handled by our tools.
Release Highlights (20 Feb 2018)
USB Artifact Analysis Improvements (evtwalk, evtx_view, cafae, and yaru)
We finally added event log analysis to the usp tool. Event logs used here are the .evtx type logs and not the WinXP .evt type logs. For USB type artifacts, the tool looks at the following logs: (a) System.evtx, (b) Microsoft-Windows-DriverFrameworks-UserMode%4Operational.evtx, (c) Microsoft-Windows-Kernel-PnP%4Configuration.evtx, and (d) Microsoft-Windows-Partition%4Diagnostic.evtx.
The challenge in using event logs for USB report generation, is an event log, in general, can contain numerous events for one USB action, so filtering and translation needs to be done to highlight significant USB actions. A second issue for a tool designer, is how to effectively merge the filtered eventlog transactions with the artifacts obtained from other sources (eg. various registry hives and setupAPI logs). A typical strategy that is helpful, is to record all the transactions in a log2timeline output. This merges the temporal sequence of transactions that occurred on the system into a linear timeline. Unfortunately, merging sequences of transactions doesn't necessarily consider the association of a transaction between one USB device and some other device, so the analyst must use other techniques to group which transactions go to which device. To compound the problem, for plug-n-play events, there may be a single event ID to identify (insertion and removal of the device); this means the event log parsing tool needs to go further and look at the plug-n-play function number used to determine whether the device is being 'started' (eg. inserted) or 'stopped' (eg removed).
With this new version of usp, all the above issues are addressed. The sequence of transactions are preserved, as well as the merging of eventlog transactions to the other artifacts so that the association the various devices on the system are maintained. The also tool addresses the deeper event log parsing so it can categorize the event log transactions into 3 basic areas: (a) when the USB device was inserted, (b) when the USB device was removed, and (c) when the USB device driver/service was deleted. As a bonus, additional data is extracted from the Microsoft-Windows-Partition%4Diagnostic.evtx type log, such as the partition table and volume boot record of the USB device. To see combined grouping of USB devices and the sequence of timelined actions, the log2timeline output (via -csvl2t) has been modified to capture this and retain a traceability back to each event record. Please refer to the usp user guide for more details.
Debug symbols - discussion (sf, pescan, pe_view)
Not so much so for forensics types, but this area is for those who spend a fair amount of time debugging and reverse engineering. Having the proper debug symbols make the job go from difficult (without symbols) to much easier. In most cases, if you need to get a set of debug symbols for the Windows OS, your debugger (WinDBG, for example) would go out to the Microsoft symbol server and request them without any user interaction. The Microsoft symbol server is public service that allows debugging tools to access their respository of public symbols. Recently, however, the Microsoft symbol server went from allowing tools to request compressed downloads, which was the norm since the inception of the service, to only allowing uncompressed downloads. This broke our sf (symbol fetch) tool. So we modified sf to handle either case (compressed or uncompressed), transparently; so it should work either way without the user doing anything different. For those not familar with this tool, it allows one to enumerate any portable executable (PE) file on your system, pull out the debug GUID signature/metadata, and query the Microsoft symbol server for the proper symbols that go with that PE file. The use-case for this tool is to collect various symbol files from a box with an Internet connection, and sneaker-net the collected symbol files to a closed system where development and analysis is done.
Related to this topic, and probably of more interest to the forensics analyst that deals with malware, is the enhancement made to the pescan report generation. At the request of one of our clients, we added (amongst other data), the debug directory data associated with the path/filename where the symbol file was generated. As background, to those unfamilar with this topic, each PE file can have a debug directory as part of its composition. This is the primary way a debugger knows how to find the debug symbols related to that executable, library or device driver file. Thus, when a developer creates a new tool (or builds an update to that tool), the compiler defaults with embedding certain debug metadata, so that the resulting PE file generated contains the file (and path, if necessary) where the symbol file was generated. This compiler setting would need to be explicilty turned off by the developer if they didn't want this functionality. What this means, in general, is that most PE files in the wild, have the symbol filename embedded into the PE file. This happens to be the same PE directory area where the debug GUID and associated metadata live, and consequently, where the the sf tool obtains its data as well.
So, why is the path/file of the symbol file of interest to some malware analysts? In short, if the path is present, it can give you some clues about the source of the local development tree. For example, when a developer builds a tool, they are usually in an area in some parent folder that is common to where other tools are being (or have been) developed. Therefore, if the path is correlated with other PE files, one can deduce whether the author of the tools is the same person, or in some cases, organization. Going further, this debug section also has a timestamp embedded into its data, and if the date/time doesn't closely match the compile timestamp, then it implies someone explicilty changed the compile timestamp after the build which is abnormal. For these cases, you are relying on many of the malware writers to understand what the compile timestamp is, but not necessarily the intricacies of the PE internals, and other less know areas where these other timestamps are located. Some of the more sophisticated malware authors remove the debug section from the PE file for this reason. Many of the less sophisticated authors do not. For those wanting to study this in more depth, one can look at the internals using any number of PE viewer tools, including our pe_view tool.
gena update
When looking at a VMWare volume, gena was hardcoded to assume the volume started at offset 0. If it didn't find an NTFS volume at offset 0, it would fail. This has now been changed so gena will examine the VMDK (eg. disk) and display the various volume offsets it found allowing you to selected the proper NTFS volume to analyze.
Release Highlights (15 Dec 2017)
Win10 Compatibilty Fixes
This release was focused various bugs fixes and Win10 compatibilty issues. See individual readme files for the details.
Release Highlights (27 Oct 2017)
cafae and yaru updates
With the October release of Windows 10 Fall Creators Update, the number of Amcache artifacts has grown. In addition, the Amcache format was changed on some existing artifacts. Therefore, both cafae and yaru have been updated to accommodate the additions and changes. The tools will automatically sense which version of the Amcache hive is present during the parsing process, making the operation transparent to the user. The report generated, however, will either have the same artifacts as before or more, depending on the version of the Amcache processed.
Also updated with these tools is the user hive registry parsing to include the HKCU\Software\Microsoft\Windows\CurrentVersion\Search\RecentApps artifact in the output report.
usp updates
Since the newer version of the Amcache hive has device plug-n-play data, there was an attempt to integrate portions of this data into usp's reporting. This enhancement is still beta, and as such, to invoke this new option, one is explicitly required to use a separate command. This was done to ensure the older usp processing is minimally impacted with the change in the codebase, while more testing and analysis is done. Information on how to use this new option is in the readme or user's guide for the tool.
At the suggestion of one of our clients, we enhanced the output of usp's -csvl2t option, by adding the LastRemoval and LastArrival times to the MACB output. Previously, it was only included in the overflow field (or field labeled 'extra') in the log2timeline output. This change allows the additional data to be integrated into one's timeline analysis.
The final enhancement includes the processing of some additional setupapi log files introduced with Windows 10. Previously usp targeted the setupapi.dev.log and its related archived versions (eg. setupapi.dev.yyyymmdd_hhmmss.log), since this log recorded installations (and de-installations) of USB devices. With this new version of usp, it will now will look at other variants of setupapi log files, such as: setupapi.upgrade.log, setupapi.setup.log, etc, since these other logs also contain information about USB devices.
csvdx update
A new option was added to csvdx to allow one to take a mixed artifact CSV report and group each unqiue artifact type into separate CSV files. As background, some of the TZWorks tools (like cafae, evtwalk and others) will process raw artifact files and produce a combined CSV report. This allows them to operate in a batch processing mode and will allow one to process many files in one session. The other benefits are faster processing times while minimizing the footprint of new files generated on the target box (since our tools are designed for live collection/processing). The challenge with merging differing artifact types into one report, is separating those same artifacts out later when desiring to put them into a database. So that was the objective with this new option, to take any of the reports generated by cafae or evtwalk and group unique artifacts together in their own CSV file.
While still beta, this option contains some other nice things, like: (a) handling interspersed artifacts and grouping them appropriately, (b) pulling out all banner information from the original CSV file, and (c) allowing one to continuously process other CSV reports and merge their artifacts into previous files generated. More information about this option is in csvdx's user's guide and/or readme file.
Release Highlights (30 Aug 2017)
New Tool Added - tela
tela is short for Trace Event Log & Analysis. It was designed to parse ETL (Event Trace Log) files that have been common in Windows for some years now. As background, Windows incorporates a built-in framework for logging and diagnostics that go beyond the standard event logs (.evt or .evtx files). From a forensics standpoint, these trace logs (.etl files) contain information that could be useful to the DFIR analyst, since timestamps for the events are present, which user SID/process ID was responsible for the action, and they can contain formatted messages provided by the application. The information is similar to that in the normal event logs, but with the trace log, much more information is provided from a frequency standpoint. The time intervals between each record is much shorter. While great for performance tuning and debugging, they can also be used to subvert security to gain information about a system by attackers. These logs can be turned on and off easily, and the ETL framework allows easy remoting of the log data to another machine.
To date, there are only a few tools available that parse ETL files reliably, and most of the good ones are from Microsoft. The goal with tela was to have a portable version (to work on Linux, macOS as well as Windows) that could parse ETL data across the various types of providers. The other goal was to break out the various disjointed provider data into common fields to make it easier to export the parsed data into a separate database. Even though tela is still in the prototype/experimental phase, it does a good job of parsing out much of the metadata contained in these files across the various providers. The current version only authenticates for clients that have an enterprise license. More information about this tool and its capabilities can be found here.
Registry Stats and Entropy
This subject affects both cafae and yaru. Based on suggestions from a client, the functionality to scan for 'very large values' as well as 'high entropy values' was added into these tools. The term 'high entropy' means close to random data, which occurs when something is encrypted (highly random) or uses a compression algorithm (mostly random). Both tools now have this capability. See the respective readme or user guide to get the details about how to use these options, if interested.
TypedURLs & TypedURLsTimes
These are subkeys in the ntuser.dat registry hive. One provides the browser URLs and the other provides the timestamp associated with the URL entry. Since they are separate subkeys, the reporting was disjointed. With this update, the data from both subkeys are merged into one report.
Message Table extraction
This is something that relates to certain Portable Executable (PE) files. Message Tables, if they are present in the PE file, are embedded in the resource section. Message Tables are used to store event log templates and ETL (tracelog) templates. Both pescan and pe_view had (and still have) this parsing ability. This updated version of the tools, however, required us to 'beef up' the parsing in this area to accomodate the reversing the ETL internal structures for the tela tool discussed above. Secondly, we incorporated the ability for tela to invoke pescan, if desired, to pull out the Message Table resource quickly and display it, to assist in analyzing differing provider template data.
USB history
A couple of bugfixes where added to usp as they relate to the WinXP version of the SetupAPI log. If you are using an older version of usp and are parsing USB artifacts on an WinXP image or box, then upgrade to this newer version.
Release Highlights (04 May 2017)
Eventlog Tool Updates
Enhancements were added to the eventlog parsing engine to handle those cases where EVTX logs don't contain template references. As background, normal EVTX logs have embedded templates to identify the context of the binary XML data. These templates provide for a more compact way of storing the complete log information. Without the template, each record in the log needs to include the context of the data, which in turn, makes a larger log file. However, doing it this way, allows for ease in forwarding events from a client machine to another machine acting as a log collector, since all the state/context information is encapsulated in the record itself. These logs are referred to as forwarded event logs, and because of the reasons just stated, usually will not contain any template references. These logs also contain other nuances, such as, 2 timestamps and 2 record identifiers per record, since one of the record id's and timestamps will be from the client machine and the other will be from the collector. These types of logs can now be handled with version 0.38 of evtwalk and version 0.94 of evtx_view.
A second enhancement was made to evtwalk to allow on to create a new EVTX log that is a subset of an existing EVTX log. Occasionally, it is necessary to strip out specific records and/or certain events from a very large log, and create a separate log that is much more managable. This is usually done to aid in debugging problem logs. Since this may also be useful for clients for other situations, it was made available as a new option [-createlog], which will allow one to create a subset log based on either an event identifer(s) or record number/range.
Shimcache data for Win10 Creators Update
The Shimcache data structure was extended with the latest update for Win10. Microsoft has coined this new update as the "Creators Update". Changes were made to the tools: wacu, cafae and yaru to allow them to handle the changes in the new format.
Registry Parsing of Corrupted Hives
There are cases when one will come across corrupted hives, or be able to partially reconstruct a hive from another tool. One situation, where this happens frequently, is in the reconstruction of hives from a memory capture (ref: the Volatility plugin dumpregistry). In some cases, the desired hive(s) can be reconstructed completely. In other cases, the desire hive(s) may have portions of the data paged out (eg. which means the needed data was not in physical memory) at the time of the memory capture. For the latter case, the reconstruction of the hive(s) would be incomplete due to the hive having holes in the dataset and can cause any number of registry parsers to crash. Our tools were no exception, and were susceptible to this issue as well. So we decided to beef up the error checking on our registry parsing engine to try to account for these types of corrupted hives. This new update makes the registry parsing engine more robust, and from our preliminary tests, show it can withstand most hives with holes in them. Keep in mind, this is an on-going process, and there will be some situations where the tool may not handle the corruption. Therefore, if you encounter a hive that causes any of our tools a problem, please contact us.
Improvements to dup
Modified dup to be more robust for drives with bad sectors. In addition, updated the -pull_evtlogs command to also extract Event Trace Logs (ETL) from the system directory.
Release Highlights (23 Mar 2017)
Additional improvements to jp
In addition to the improvements discussed earlier in the month, we had a new request to see if we could address USNJRNL artifacts in slack space. So with this latest version, there is a new option called -include_slack_space. It will traverse all the MFT records, scanning slack space for change log journal records and, if found, add their parsed content to the report. Also, to help out with the manual verification of the data, whether it be from unallocated data, Volume Shadow clusters, or just slack space, we improved the option -show_offset, which will annotate the drive offset of the where the USNJRNL artifact was found.
Improvements to lp
We have been getting requests to extend the functionality of our LNK parser. So with this update, we added our NTFS engine into the parser. This allows the tool to specifically target the MFT records, unallocated clusters and Volume Shadow clusters. When combining these options together, the tool yields more results than the previous -rawscan option, which just looked at the sector signatures to locate and parse LNK metadata. For those curious why the new option yields more results, it is because with the tool now NTFS aware, it can reconstruct fragmented files, and thus, more completely parse LNK data. While normal LNK data most likely is small and normally within a cluster size (meaning it isn't fragmented), Jump List data is typically larger since it has a collection of LNK data, and therefore, can be fragmented. So using the new -ntfs_scan option with the additional sub-options, allows lp to additionally pull out the internal LNK data from Jump Lists, thus yielding more results.
dup - bug fixes
We uncovered various bugs with imaging certain volume types using the -copyvolume option. This occured with certain GPT's (GUID Partition Tables) and extracting the partition information, or lack thereof, using some older APIs. With this updated version, this is fixed and should handle various partition tables whether MBR or GPT. Other bugs were also found in compression/decompression routines and those were fixed as well.
Release Highlights (2 Mar 2017)
New Tool Added - dup
dup is short for Disk Utility and Packer. It was designed for clients with an enterprise license to assist their incident responders in collecting artifacts from live endpoints. Later, after all the raw artifact data is collected, they can process and analyze those artifacts on a forensic workstation.
Still in the prototype/testing stages, the tool can: (a) generate disk stats, (b) do simple master boot record analysis, (c) image a drive, volume or a specific set of clusters, (d) target the volume shadows and (e) copy files or folders. dup offers an internal scripting capability to automate collection, as well as a few utilities to assist in merging and combining files. More information about this tool and its capabilities can be found here.
Improvements to jp
We expanded the functionality of jp to target Volume Shadow clusters whether the Volume Shadow Snapshots are mounted or not, via the new option -include_vss_clusters. This option can be used in combination with targeting unallocated clusters (via -include_unalloc_clusters). Using both of these options together can produce extensive change log journal entries.
Also, we added the ability of jp to recognize multiple change log journal formats within a single log file. Specifically, these newer formats are designated as USN v3 and USN v4 and can be use with the newer Windows operating systems. For those not familar with the versions, the normal version for a Windows operating system is USN v2. These other formats are not enabled by default. They, however, can be invoked by an administrator. The details of these other records are defined in the Microsoft SDK (sofware development kit) and the contents of internals are shown in jp's readme file. The newer formats allow for 128 bit inode values as opposed to 64-bit, range tracking, and other enhancements.
Improved handling of files with NTFS native compression
We beefed up the NTFS native compression library robustness, to improve handling of files that are compressed by NTFS on the filesystem. This improvement affects all the tools that access the raw NTFS clusters, including: ntfswalk, ntfscopy, ntfsdir, gena, wisp, sbag, cafae, wacu, yaru, usp, elmo, tia .
Release Highlights (Nov 2016)
New Tool Added - tia
At the request of one of our clients, we created this new tool. tia is short for Trash Inspection & Analysis, and as its name suggests, parses Windows trash (or Recycle Bin) artifacts. The tool is designed to work with the different versions of these artifact formats from WinXP to Win10. The tool has the ability to scan various locations looking for current or deleted trash artifacts, including: (a) the MFT table, (b) the volume shadow snapshots, and/or (c) unallocated clusters in a volume. More information about the tool can be found here.
Expanded functionality added to usp
We updated the parsing engine for usp to be more flexible in how it parses USB artifact data. Specifically, the older engine initially looked for the data from the System hive and then used what it found to proceed to the other artifacts (such as the Software hive, SetupAPI logs, etc). While this approach is fine and works, with the advent of USB cleaners and USB device removal software built into the new versions of Windows, the USB artifact data in the System hive can be mostly removed. Therefore, to account for this, we changed the usp algorithm to not rely on the System hive data. While the tool still uses the data in the System hive and integrates it into the reporting, one can run usp without using the System hive.
In addition, we added a number of new enhancements to the tool: (a) ability to parse multiple system hives (or software hives) in one session and merge the results into the reporting, (b) ability of the tool to injest all the artifact files via standard input, using the -pipe option (which makes it much easier to pass in artifact data into usp), (c) option to show additional metadata (and timestamps) in the report, and (d) the option to go after both the primary and RegBack (or backup) hives in one session. More information about the tool/updates can be found here.
Downloads
| Intel 32-bit Version | Intel 64-bit Version | ARM 64-bit Version | ||||
| Windows: | 2025.04.26.win32.zip | 2025.04.26.win64.zip | 2025.04.26.win64a.zip | md5/sha1 | ||
| Linux: | Not Available | 2025.04.26.lin64.zip | 2025.04.26.lin64a.zip | md5/sha1 | ||
| Mac OS X: | Not Available | 2025.04.26.mac.dmg | 2025.04.26.mac.dmg | md5/sha1 | ||
| *32bit apps can run in a 64bit linux distribution if "ia32-libs" (and dependencies) are present. | ||||||