Trace Event Log and Analysis (tela)
Introduction
Event Tracing for Windows or ETW, is a built-in, logging and diagnostic framework available to all. It can be dynamically enabled, and the data it generates can be logged to a file or consumed in real time by another application. It can be used for performance analysis, general debugging, or in our case, for forensics purposes. ETW was first introduced in Window 2000. It started as a modest set of providers and was expanded with each new version of Windows. With Windows 10, the number of providers grew to over 1000. Windows 10 also added TraceLogging to ETW to allow for event tracing for user-mode applications and kernel-mode drivers.
Currently there are a number of free tools from Microsoft that parse Event Trace Log (ETL) files. The most common, is the standard Windows Event Log Viewer. It will render ETL files, and convert the format from .etl to .evtx, if desired. The other, more extensive parsing tool, is the Microsoft Message Analyzer. It will do a good job of parsing not just the record header information, but also try to parse each record's payload data.
Therefore, when looking at the requirements for a new ETL parsing tool, tela needed to address the problem ETL cases where the Microsoft tools had trouble (as well as the normal ETL files). The problem cases were those files that were used in a temporary manner, such as those in the SystemRoot/System32/LogFile/WMI/RTBackup folder. The files in this folder sometimes had their header information zero'd out, in some instances, their records were still present. While tela was successful parsing these temporary records (even if the file header was zero'd out), the accurate parsing of the payload data is still a work-in-progress. Given the payload data in these records are governed by the provider, and considering there are over 1000 current providers, the evolution of the tool will be ongoing for some time. While, our test results are positive thusfar, tela is still very much a prototype tool, and should be treated as such. The current version of this tool only authenticates for clients that have an enterprise license.
Usage
To just parse a single ETL file, one uses the -log option with the argument of the path of the ETL file. This will generate a single record per line where each field is delimited by a '|' (pipe) character. Redirecting the output to a file is recommended, since the widths of the records are large. The other basic option is to enumerate a set of files in a folder and pipe them into tela via standard input. These options are the first two shown in the menu below.
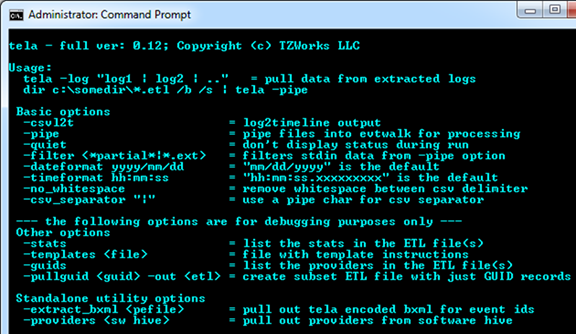
The basic options are used for formatting and filtering. The syntax and functionality are the same as with the other TZWorks tools we offer.
The section following this are basic options left for reversing and debugging. Normally, these areas are for internal use, but they were left in for clients to help make sense of or verify any output that is processed. The use and their meanings are discussed in the tela user's guide.
For more information
The user's guide can be viewed here
If you would like more information about tela, contact us via email.
Downloads
| Intel 32-bit Version | Intel 64-bit Version | ARM 64-bit Version | ||||
| Windows: | tela32.v.0.31.win.zip | tela64.v.0.31.win.zip | tela64a.v.0.31.win.zip | md5/sha1 | ||
| Linux: | tela32.v.0.31.lin.tar.gz | tela64.v.0.31.lin.tar.gz | tela64a.v.0.31.lin.tar.gz | md5/sha1 | ||
| Mac OS X: | Not Available | tela.v.0.31.dmg | tela.v.0.31.dmg | md5/sha1 | ||
| *32bit apps can run in a 64bit linux distribution if "ia32-libs" (and dependencies) are present. | ||||||