Windows Event Log Viewer (evtx_view)
Introduction
evtx_view a GUI based tool that can parse Windows event logs from all versions of Windows starting with Windows XP. This includes Vista, Windows 7, Windows 8 and the server counter parts.
The output is presented as a tree-view where one can select the components of an event log and display their internal structure. The tool allows one to generate reports for certain specific event log categories, such as USB plug–n–play events, credential changes, password changes, etc. If one of the available reports does not address an analyst's needs, there is an option for a custom, user–generated report to be used and processed.
How to use evtx_view
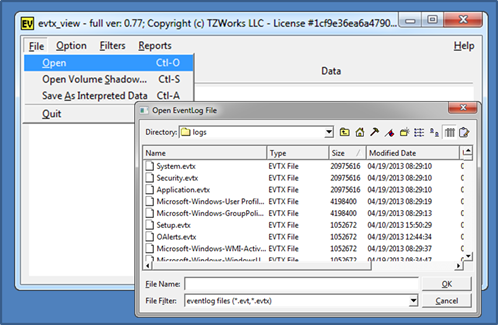
Once evtx_view is launched, the tool will try to establish administrator privileges. This is to allow it to access the Windows event log directory on a live host machine. To analyze an event log, one just navigates to the desired log, and evtx_view will attempt to parse each record in the log. Since evtx_view uses the FOX (Free Objects for X) as the GUI engine, the main GUI panel and dialog boxes are different from the normal Windows operating system ones. While the differences are minor, the FOX toolkit allows developers to easily port GUI tools from one operating system to another relatively easily.
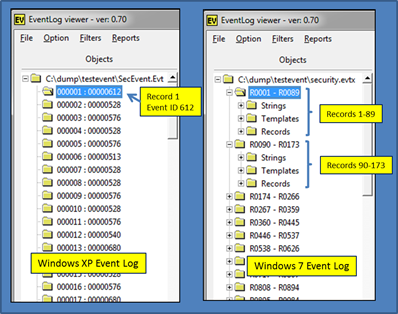
Once the data is parsed, one can navigate to each record or structure from the tree-view pane. Depending on which type of log file is analyzed, this portion of the GUI is broken up into chunks of records for Windows 7 logs or individual event records for Windows XP. Below is a screenshot of how Windows XP is rendered vice Windows 7. The rendering difference is a reflection of how the two operating systems internally structure their respective event log. Windows XP is just a sequence of records, while Windows 7 encapsulates a chunk of records in what is called an ElfChnk. evtx_view preserves this by displaying each log's internals.
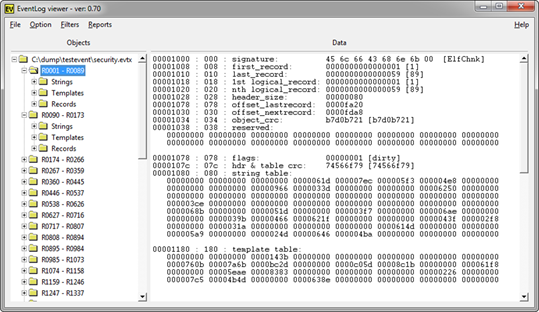
From the tree-view, one can select individual records to display, or in the Window's 7 case, display the associated ElfChnk. Below is an example of looking at selected Windows 7 ElfChnk. As one can see, all the internals of the structure as well as the file offset are displayed. While not normally used by the analyst, this type of breakout is useful for the reverse engineer.
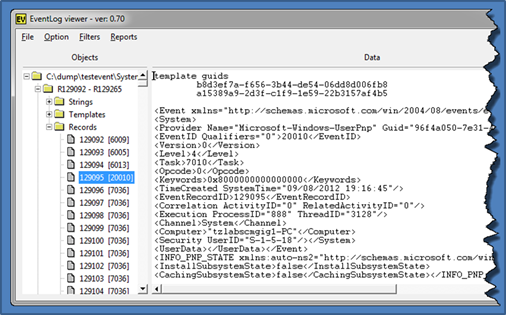
Navigating down to an individual record, one can display the associated data for that record. Unlike the data for Windows XP, for Windows 7, the event log metadata is expressed as binary XML. The screenshot below shows the re-generated XML data for a Windows 7 record.
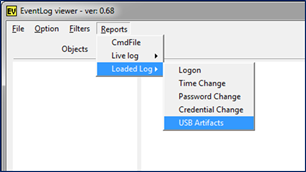
Event Category Reports
While viewing the record data is useful, pulling out specific events and packing a timeline of events into a report is usually more useful to the average analyst. For this use–case, evtx_view has a couple of options to pull specific events based on category type.
The screen shot below shows the current categories that are available. The difference between the "Loaded Log" and the "Live Log," is the former targets the event log that is loaded into the GUI and the latter targets the appropriate event log(s) on the live host machine.
If there are other reports an analyst wants to use that are not in the above list, or if one wishes to make modifications to the reports above, one can define one's own report. More information on this is discussed in the readme file as part of the tool download.
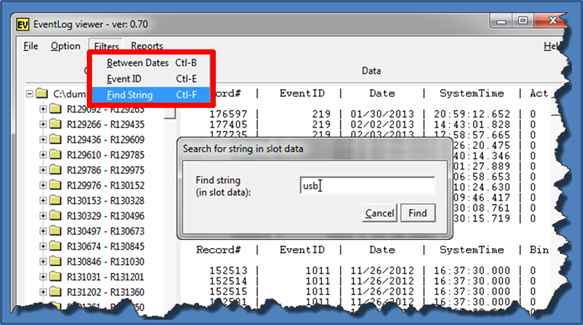
Extracting Records using Filters
One can use the available filters to find certain records of interest. Currently, the evtx_view filter menu has options for: (a) date range, (b) event id(s) or (c) a string pattern. The example below searches for the string "usb" in the record data. The result is also shown. Each 'like record' type is grouped together in the output, so that each specific event ID header can be included as part of the grouping.
Examining the Record Internals
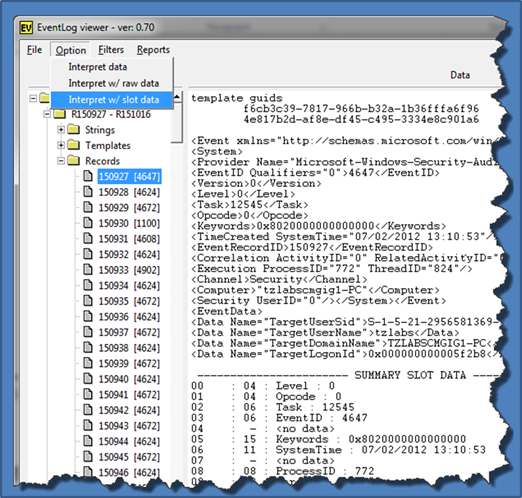
Occasionally it is necessary to examine the raw data of the event record to verify the XML records generated are correct. To look at the raw data, one has two options: (a) either to look at the record with the associated hexadecimal data or (b) to look at the record with the raw slot data (Vista and later). Below is a screenshot of the latter option. The bottom of the right pane shows the slot data associated with the record.
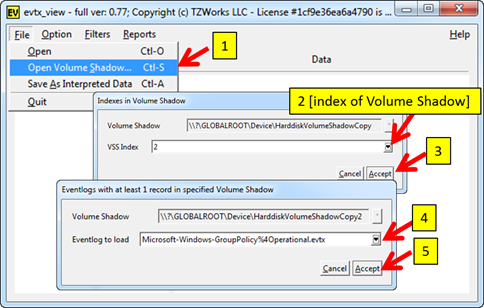
Handling Volume Shadows
To analyze a Volume Shadow, one first needs to identify the index of the volume shadow copy one wishes to analyze. Fortunately, evtx_view figures out which snapshots are available and presents them to the user in a dropdown selection. This process is show in the figure below. Each step is numbered in the order that it is executed.
For more information
The user's guide can be viewed here
If you have any questions about evtx_view, contact us via email.
Downloads
| Intel 32-bit Version | Intel 64-bit Version | ARM 64-bit Version | ||||
| Windows: | evtx_view32.v.1.23.win.zip | evtx_view64.v.1.23.win.zip | evtx_view64a.v.1.23.win.zip | md5/sha1 | ||
| Linux: | evtx_view32.v.1.23.lin.tar.gz | evtx_view64.v.1.23.lin.tar.gz | evtx_view64a.v.1.23.lin.tar.gz | md5/sha1 | ||
| Mac OS X: | Not Available | evtx_view.v.1.23.dmg | evtx_view.v.1.23.dmg | md5/sha1 | ||
| *32bit apps can run in a 64bit linux distribution if "ia32-libs" (and dependencies) are present. | ||||||