Windows Event Log Parser (evtwalk)
Introduction
evtwalk is a command line tool that can parse Windows event logs from all versions of Windows starting with Windows XP. This includes Vista, Windows 7, Windows 8 and the server counterparts.
The output is presented with one event record per line and includes a couple of formatting options. Under the hood, evtwalk uses the same eventlog parsing engine as evtx_view. As a command line tool, evtwalk can easily be incorporated into any analysts' processing work-flow by automating the execution of evtwalk via any scripting language.
evtwalk allows one to generate reports of specific event log artifacts, such as USB plug-n-play events, user credential changes, password changes, logon/logoff events, etc. If one of the available report options does not address an analyst's needs, there is an option for the user to generate his/her own custom report to be used and processed.
Event Logs and some Differences between Operating Systems
Windows event logs reside in different locations depending on whether one is on a Windows XP box or later version, such as Windows 7 or 8 box. In addition to the location differences, there are also (a) naming differences in the event log file itself, and (b) significantly more event logs present starting with Vista and the later operating systems. For example, Windows 7 can have over 70 unique event logs versus the three present in Windows XP. Below are the locations for the event logs with the various Windows operating systems.
Windows XP and earlier:
%windir%\system32\config\[AppEvent.Evt | SecEvent.Evt | SysEvent.Evt]
Windows Vista and later (Windows 7, Windows 8, ...):
%windir%\system32\winevt\logs\[Application.evtx | Security.evtx | System.evtx | ...]
How to use evtwalk
While the evtwalk tool doesn't require one to run with administrator privileges, without doing so may restrict one to only looking at separately extracted event logs, depending on the version of Windows and how the permissions are setup. Therefore, it is recommended to run evtwalk with administrator privileges, if desiring to look at the event logs on a live host machine.
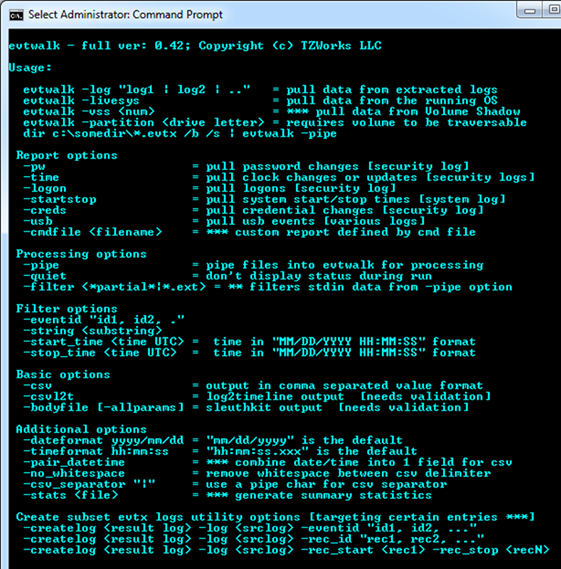
One can display the menu options by typing in the executable's name with no parameters. A screen shot of the menu is shown below:
For basic usage and to parse an individual event log file, use the following notation:
evtwalk -log <event log file> > results.txt
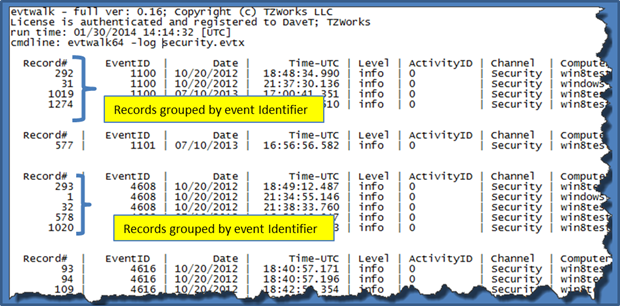
Without specifying one of the format options, the output is rendered with a custom CSV format that uses the pipe character "|" as a delimiter vice a comma. The snapshot below is an example of what this output looks like. Notice that all similar event IDs are grouped together. This allows each grouping to have their specific unique headers (if applicable), since different events have different metadata.
In the command used above, the output is redirected to a text file called results.txt. Like all artifacts that have many records, and where each record has multiple fields, the output that is generated is usually very long and wide. Thus, it is recommended that one redirect the output of the command to a file.
Besides the default CSV output, one can render the output in two other formats. Switches for these other options are: (a) -csvl2t and (b) -bodyfile. Each respective format option will attempt to conform to either the log2timeline format or the SleuthKit"s body-file format, as appropriate.
While parsing one event log file is useful, one will usually want to parse multiple event logs in one session. There are three ways to do this: (a) specifying individual event logs via multiple -log option where each log filename is delimited by a pipe character, (b) using the -livesys option or (c) using the -pipe option.
Specifying Multiple Individual Event Logs
To use the -log <event log file> option to specify multiple event logs, use the pipe delimiter between each event log name, as shown below.
evtwalk -log "<event log1> | <event log2>" > results.txt
This is useful when pulling a similar category of artifacts from multiple event logs. A good example of this is pulling USB events. The two logs needed for USB plug-n-play events are the System event log and DriverFrameworks-UserMode event log. If one extracts these two logs, one can invoke the following, rather lengthy, command to process all USB events from the two logs:
    evtwalk -usb -log "system.evtx |
           Microsoft-Windows-DriverFrameworks-UserMode%4Operational.evtx" >
            results.txt
The results.txt file will sort all "like USB" event IDs into groups and provide appropriate header fields that match the record metadata for each class of event.
Examining all the Event Logs on the Currently Running Machine
For a live system, one can use the -livesys switch to examine all the event logs on a host machine. In this mode, evtwalk will determine the Windows version of the host machine, and then will scan the appropriate event log directory for that version of Windows. Below are some examples:
    evtwalk -livesys  >  results.txt
    evtwalk -livesys -string "tzworks"  >  results.txt
The first example will traverse all event log files found in the Windows event log directory and parse each record for each event log encountered. The second example adds the -string filter option. It will also examine all the same event logs in the first example, but will only output records that contain the string "tzworks" in the one of the record fields. More information about the various filter options are discussed in the readme file that is included in the tool download.
Examining Multiple Event Logs in a Directory or Subdirectories
If looking at a collection of event logs that are not part of the running operating system, but gathered as part of an investigation, one can invoke the -pipe switch to analyze all desired event logs in one session. The -pipe switch tells evtwalk to receive a separate path/filename per line as input and process each entry separately. By redirecting the output of the processed records to a file, one can generate a single report for all the event logs piped in.
Depending on whether one is running on Windows or Linux during the piping operation, the syntax is different. For Windows, one can use the built-in dir command along with some of its companion switches to get the desired result. Below is an example of using this option:
dir c:\testcases\*.evtx /b /s | evtwalk -pipe > results.txt
The above syntax will process all the event log files with the extension .evtx that are located anywhere in the c:\testcases directory and subdirectories.
Event Category Reports
Instead of outputting all the records that are present in an event log, one may only be interested in a certain class of event data. Depending on how the host machine was configured, for event records to be present, one may need to enable the event logging for a desired class of events.
Below are the report categories currently available for this tool:
- Password changes
- Clock changes or updates
- User logon/logoff events
- System start/stop times
- User credential or permission changes
- USB events
If there are other reports an analyst wants to use that are not in the above list, or if one wishes to make modifications to the reports above, one can define one's own report via the -cmdfile <path\file> option. The argument passed in is a user generated text file that identifies which events to pull and which fields in the event record to output. These 'cmdfiles' are called 'User Defined Templates'. More information about the format and rules to generate one of these files can be located in the readme file as part of the tool download.
For more information
The user's guide can be viewed here
If you have any questions about evtwalk, contact us via email.
Downloads
| Intel 32-bit Version | Intel 64-bit Version | ARM 64-bit Version | ||||
| Windows: | evtwalk32.v.0.65.win.zip | evtwalk64.v.0.65.win.zip | evtwalk64a.v.0.65.win.zip | md5/sha1 | ||
| Linux: | evtwalk32.v.0.65.lin.tar.gz | evtwalk64.v.0.65.lin.tar.gz | evtwalk64a.v.0.65.lin.tar.gz | md5/sha1 | ||
| Mac OS X: | Not Available | evtwalk.v.0.65.dmg | evtwalk.v.0.65.dmg | md5/sha1 | ||
| *32bit apps can run in a 64bit linux distribution if "ia32-libs" (and dependencies) are present. | ||||||